中文
ENGLISH
中文
ENGLISH
Tolerancing is an important aspect of the manufacturing industry. It is a core feature in the Geometric Dimensioning and Tolerancing (GD&T) system that designers use to convey key part features and their associated tolerances to the production department.
Tolerance stacking is an important technique in tolerancing that applies to ‘stacked-up’ geometric features. It helps to ensure that production processes are accurate, convenient, and financially viable.
This article dives deep into tolerance stack up by explaining what it is, its types, and some best practices recommended by experts.
The tolerance stack is the cumulative situation of geometric tolerances of features that are connected. In essence, this can be simply understood as the individual tolerances of a part’s features are added up, and their aggregate effect on the part’s entire tolerance.
Tolerance stacking is a useful analysis that ensures that the part and its constituent features are all feasible to manufacture. It helps avoid situations where the part’s features are within tolerance, but the part as a whole is out of tolerance and gets scraped.
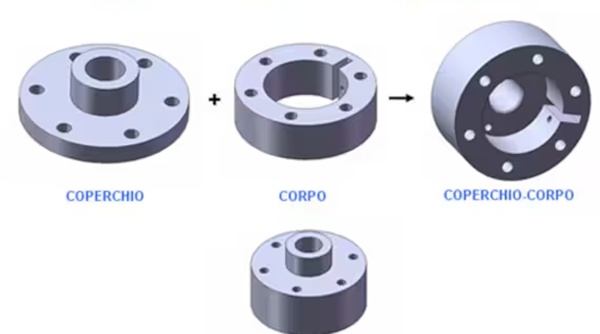
Let us take the example of a plate with multiple side-by-side pin holes. The holes and their locations on the plate are its critical tolerance features. There is a possibility that all the holes are within tolerance but at the maximum limits.
This can create a situation where all of the holes are at their largest sizes, by pure chance, and there is not enough material left between them to support the plate. This will create a situation where although the main features are in-tolerance, the part will still fail its quality test.
This clarifies the practical need for using tolerance stack analysis. Moreover, it also helps reduce the wastage of time and money and decreases material wastage.
Engineers use two main methods for tolerance stacking. While the main function of either of these is the same, some key differences between them make them suitable for specific situations.
The worst case tolerance stack analysis is the simpler of the two. It assumes that all features are at their maximum deviation levels, which is the ‘worst-case scenario’ for a manufacturer.
While this is an unlikely event in a real production environment, the worse case technique is adopted when the stakes are high. Especially for high-accuracy parts in industries like aviation and medicine.
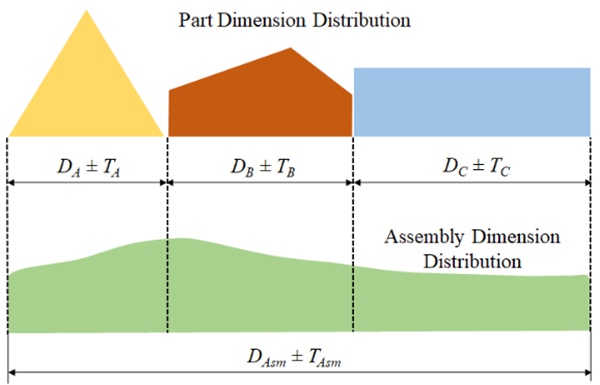
For a part with n features and bilateral tolerances, the formula to find the total variation is:

The worse case method guarantees that all parts will be within tolerance and achieve the desired engineering fit. However, this confidence comes at the cost of tighter tolerances. Due to this, it is more suitable for low-volume production as the likelihood of manufacturing parts within tolerance gets lower as the number of parts grows.
Tolerance stacking can be involved and difficult to comprehend. Thus, we present a simple tolerance stack up example to drive the point home. The figure below shows a tolerance stack with multiple features, each having its dimension and tolerance. The goal is to calculate X, the total assembly tolerance based on the worse case principle.
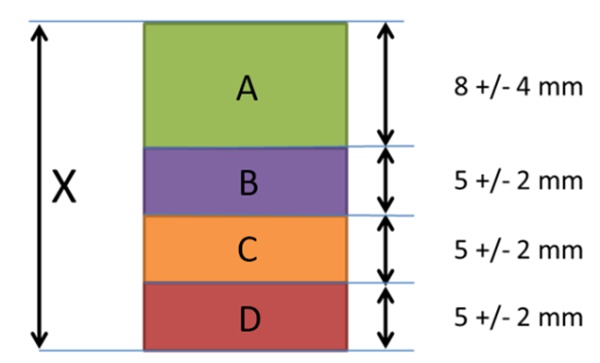
In the worse case tolerance stacking, the nominal dimension and tolerance are the sum of feature dimensions. Hence, X is calculated as:
| Element | Nominal | Tolerance |
| A | 8 | ±4 |
| B | 5 | ±2 |
| C | 5 | ±2 |
| D | 5 | ±2 |
| Assembly (X) | 23 | ±10 |
Therefore, X = 23 ± 10
The statistical tolerance stack analysis method takes a slightly more realistic and methodical approach to tolerance stacking. It uses statistical analysis to estimate the probability distribution of deviations in each tolerance dimension.
For this, the basic hypothesis is that each dimension will be different. Some will be less off, some more, exactly like it is in a real factory. Consequently, it is widely applicable in mass production environments where a small number of errors are acceptable.
After calculating these individual probability distributions, it adds them up to compute the probability of the overall part tolerance, which gives a reasonable estimate of how many parts are expected to fail the quality tests.
It utilizes various statistical techniques, but the Root Sum Squared (RSS) method is by far the most popular, which assumes a normal distribution for the dimensional deviations.
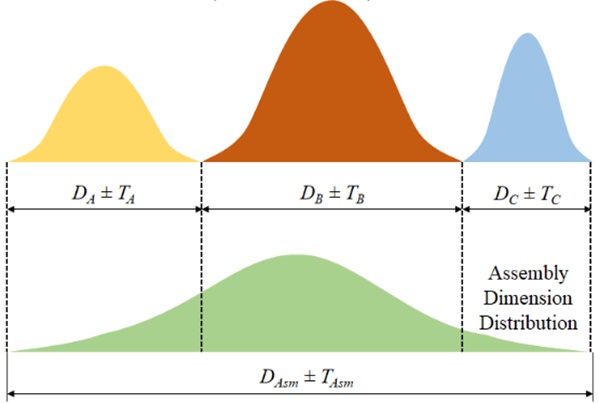
The formula to calculate the assembly tolerance, Tasm, is:

To understand statistical tolerance stacking, let us use the same example. The nominal X dimension will remain the same at 23. The tolerance is calculated using the RSS formula.

Therefore, using RSS, X is 23 ± 5.29.
Tolerance stacking is half science, half art. It takes engineering prowess to pick the most suitable chain of dimensions while performing the stack up analysis. In the sections below, we summarize the tips and tricks offered by experts on how to optimize your tolerance stack analysis.
Engineer drawings are the standard way of communicating design intent to production engineers. A common mistake inexperienced engineers make is to add tolerances to each and every part feature, which is not usually the requirement. Defining tolerances only for critical features is oftentimes adequate and automatically controls the dimensions for auxiliary features.
Thus, the recommendation is not to over-dimension your part. It complicates the manufacturing process and overpopulates your engineering drawing, causing confusion.
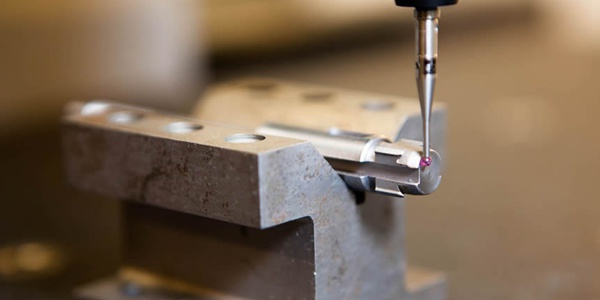
It is easy to get carried away and place tighter tolerances than required on some features. Designers must keep in mind that while their production departments can manufacture high-quality parts, the tolerancing is decided by part functionality.
Thus, both designers and manufacturers must evaluate their tolerance stack up from a practical point of view and avoid being over-strict in their approach.
This is more general advice than something specific to tolerance stacking. While drawing up their designs and tolerances, engineers should take into account the changes their part will go through during service. There is general wear and tear and maintenance that affects the tolerances over time.
Therefore, it is practical to consider these and decide the tolerances accordingly to maximize the part of life.
Tolerance stacking, like any other manufacturing utility, has transformed a lot in recent years. Modern CAD/CAE software feature tools such as a tolerance stackup calculator. Designers can choose from a variety of tolerance stack up methods, identify all possible tolerance chains in the part, and easily integrate changes in engineering drawings.
Tools like this are driving the manufacturing industry, helping engineers implement precision manufacturing methodologies such as 6-Sigma.
Tolerance stacking is one of the most useful tools in production, ensuring that parts fit well together and taking into consideration manufacturing convenience. It is a must-have skill for engineers dealing with vowin.cn' target='_blank'>product design and GD&T.
Vowin is a rapid prototyping and manufacturing company that offers one-stop precision machining services. We pride ourselves on providing effective machining solutions for your tight-tolerance machined parts. Feel free to contact us with your manufacturing needs.
Tolerance stacking ensures that parts are manufactured within defined tolerance limits for each geometric feature. It is a method to preserve functionality while maximizing manufacturing convenience.
1st order and 2nd order tolerance stacking are the terms used for worse-case tolerance stacking and statistical tolerance stacking, respectively.
There are several challenges in tolerance stacking, such as choosing the best variation of tolerance chains, considering manufacturing capabilities, and finding the correct balance between part tolerances and cost-effectiveness.


